
With Datylon, you can create the most captivating on-brand data visualizations right within Adobe Illustrator. Without coding. Boost your charting power: add annotations, titles, or any illustration, and create stunning reports, inside the Adobe workflow. Design the most beautiful and engaging report templates and export them to the Datylon web app for the rest of the team to re-use.

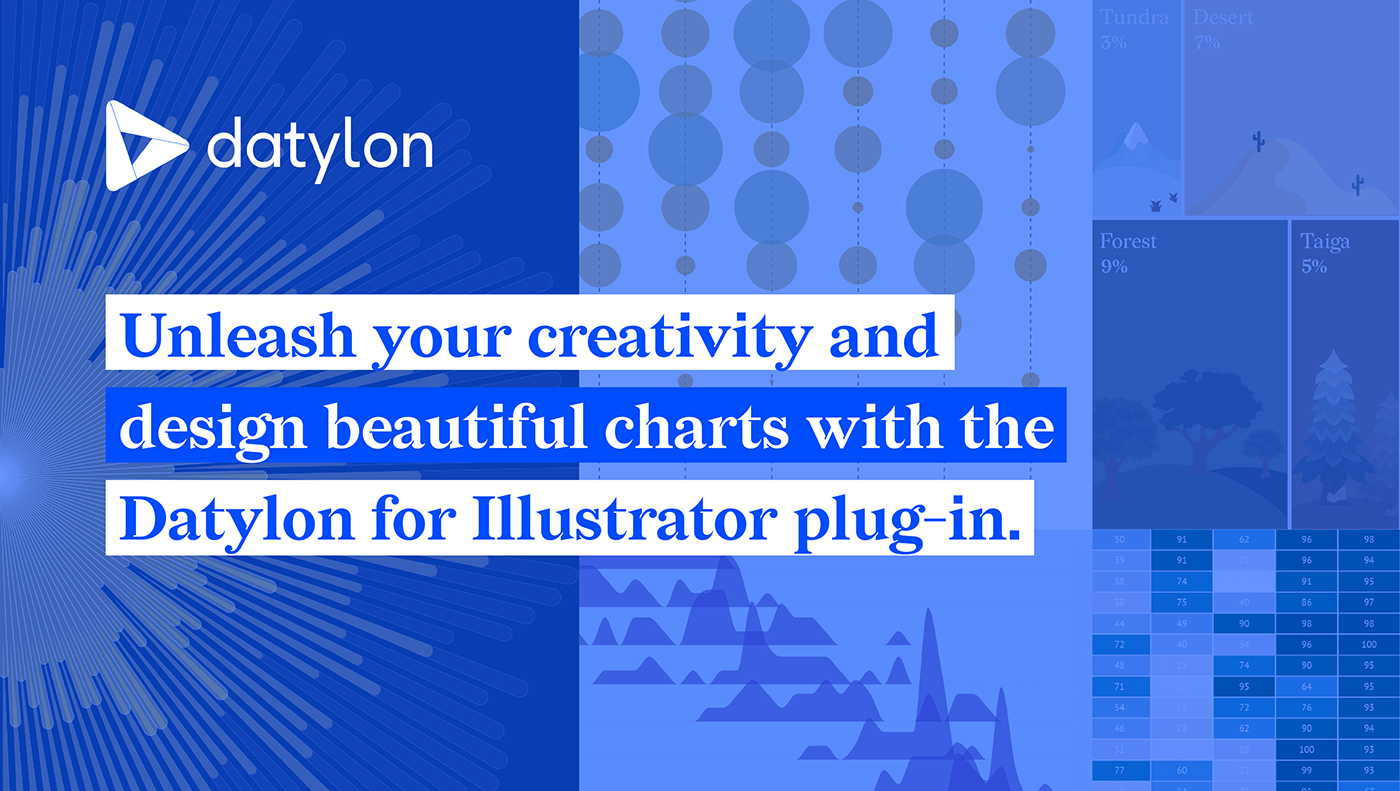
The sunburst chart design above was created with Datylon for Illustrator,
a chart maker plug-in for Adobe Illustrator.


